Multiple Choice
Identify the
choice that best completes the statement or answers the question.
|
|
|
1.
|
Justin and TJ are servers at a local restaurant. The table below shows the
tips they earned. 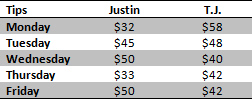 Which student has a higher
median tip for the week and by how much? a. | Justin’s median tip is $4 more than TJ’s median tip. | b. | TJ’s median
tip is $4 more than Justin’s median tip. | c. | Justin’s median tip is $3 more than
TJ’s median tip. | d. | TJ’s median tip is $3 more than
Justin’s median tip. |
|
|
|
2.
|
At a restaurant a manger recorded the sales for one of his servers named
Damaria.
$52, $60, $48, $52, $46, $52, $28, $192, $71, $59
Which center should
be used to best represent the data?
a. | Damaria’s mean sale is $70. | b. | Damaria’s median sale is
$52. | c. | Damaria’s mode sale is $52 | d. | Damaria’s range of her sales is
$164 |
|
|
|
3.
|
The number of cookies found in 10
different snack bags are shown below:
14, 12, 14, 13, 14, 14, 14, 15, 14, 12
Which
center should be used to best represent the data? |  | | |
a. | The mean number of cookies is 13.6. | b. | The median
number of cookies is 14. | c. | The mode of the number of cookies is
14. | d. | The range of the number of cookies is 3. |
|
|
|
4.
|
The following shows a list of a
student’s homework grades for a grading period:
80, 90, 84, 86, 95
Which center
should be used to best represent the data? |  | | |
a. | The mean grade is 87. | b. | The median trade is
86. | c. | The mode of the grades is 80. | d. | The range of the grades is
15. |
|
|
|
5.
|
What is the mean of the following data set shown in the dot plot: 
|
|
|
6.
|
What is the mode of the following data set shown in the dot plot: 
|
|
|
7.
|
Consider the data set represented by the dot plot:  Which word best describes the red data
point? a. | unbalanced | b. | third quartile | c. | outlier | d. | absolute
deviation |
|