Multiple Choice
Identify the
choice that best completes the statement or answers the question.
|
|
|
1.
|
Consider the following scatter plot:
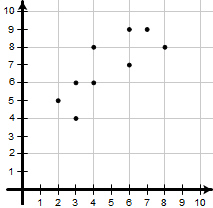 The data shows information about couples and the number of different cars
they have owned over their life time. The x-axis shows the number of cars owned by the
female of the couple and the y-axis is the number of cars owned by the male of the
couple. Which table shows the same information as the scatter plot?
|
|
|
2.
|
The data below shows the minimum wage requirement of the U.S. government
in years, x, after 1960. Based on the data provided, what would be the best linear model using
your calculator’s regression model?
|  | | |

|
|
|
3.
|
Consider the following scatter plot.
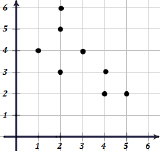 Which of the trend lines below do you think
best represents the data trend? Which of the trend lines below do you think
best represents the data trend?
|
|
|
4.
|
Which data set below has the weakest
correlation?
|
|
|
5.
|
The table
displays data for Nutrition Guides of a single serving of particular foods.
Assuming
there exists a correlation between Calories and Fat Grams, find a linear regression model determines
approximate Fat Grams (y) as a function of Calories (x).
| | | |

|
|
|
6.
|
Consider the following scatter plot and associated trend line.  What would be considered the residual of point F using the given trend
line?
|
|
|
7.
|
The data below are the final exam scores of 9 randomly selected Algebra
students and the number of hours they studied for the exam. Find the equation of the regression line
for the given data. Using a least squares linear trend line. Predict the score for
a student that studied 7 hours.
|  | | |

|