Multiple Choice
Identify the
choice that best completes the statement or answers the question.
|
|
|
1.
|
Use a graphing calculator to determine which of the following graphs represents
the algebraic function 
|
|
|
2.
|
Use a graphing calculator to determine the domain and range of 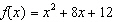
|
|
|
3.
|
Identify the Local Maximum and Local
Minimum coordinates of the function :
 . . |  | | |
a. | Local Minimum (-1,-2)
Local Maximum (-3, 2)
| c. | Local
Minimum (0, 2)
Local Maximum (4,
4)
| b. | Local Minimum (0,-2)
Local Maximum (4,2)
| d. | Local Minimum
(-1,-3)
Local Maximum (-2,
0)
|
|
|
|
4.
|
| Given the calculator table of
partial values for the polynomial function f(x), between what integer values of x would
a Local Minimum likely occur? |  | | |
a. | between x = 0 and x = 1
| c. | between x = -3 and x
= -2
| b. | between x = 1 and x = 2
| d. | between x = 2 and x =
3
|
|
|
|
5.
|
Identify the end behavior of the
polynomial function:

f(x) is shown in the
graph. |  | | |
|
|
|
6.
|
Which polynomial function graph below has an end behavior that is different from
the rest?
|
|
|
7.
|
| Identify whether the polynomial function graphed has an odd or even degree and
a positive or negative leading coefficient. |  | | |
a. | even degree,
negative leading
coefficient
| c. | odd degree,
positive leading coefficient
| b. | odd degree,
negative leading
coefficient
| d. | even degree,
positive leading
coefficient
|
|
|
|
8.
|
From which of the following
intervals does the graph of h(x) appear to be
increasing?
(Describe the
interval using INTERVAL NOTATION.) |  | | |
|
|
|
9.
|
Which polynomial function has a y-intercept
at y = 8 and an x-intercept at x
= 2?
|
|
|
10.
|
The profit in millions of dollars of
a certain business is related to the equation  , where t is the amount of time
in years after the business opened. , where t is the amount of time
in years after the business opened.
Based on this model, during what interval did the
business lose money.
(Hint: You may want to graph the
polynomial function) |  | | |
a. | 0 to 1 years
| c. | 4 to 5 years
| b. | 2 to 3 years
| d. | 7 to 8
years
|
|