Multiple Choice
Identify the
choice that best completes the statement or answers the question.
|
|
|
|
Use the following information to answer questions 1-3:
Students at Phoenix High School are given the option to take their math classes
in a traditional face-to-face (F2F) setting or on a
Computer Self Directed Learning (SDL) version.
 Face-to-Face Face-to-Face |  Self-Directed-Learning Self-Directed-Learning | | |
A survey was given at the school and found that initially 39% of students were taking F2F classes and 61% were taking SDL (Computer) classes.
•Of the students taking F2F classes, 65% suggested they would
continue taking a F2F class in the future but 35% wanted to switch to an SDL class for the next
semester.
•Of the students taking SDL classes, 78% suggested they would continue
taking a SDL class in the future but 22% wanted to switch back to a F2F class for the next
semester. In this example, what is the initial distribution matrix,
[D0], for a Markov chain?
|
|
|
2.
|
(Using the information above) Approximately how many students will be in each type of class next semester
based on the suggested percentages?
a. | 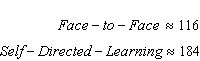
________________________ | c. | 
________________________ | b. | 
________________________
| d. | 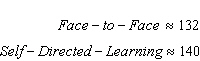
________________________ |
|
|
|
3.
|
(Using the information above) Which Tree Diagram below correctly
shows how to find the percentage of students taking each course type in the upcoming
semester?
a. | 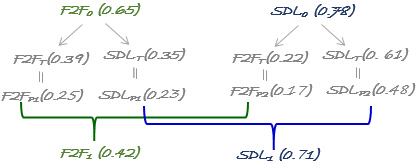
________________________________________________ | b. | 
________________________________________________ | c. |  |
|
|
|
4.
|
In Tate, Georgia an anonymous political survey was conducted of all 380
citizens. The survey showed that 40% of the population
identified themselves as democrats, 45% of
the population identified themselves as republicans, and 15% of the population identified themselves as
independents.
• Of the population that identified
themselves as democrats, 90% suggested they
would continue identifying themselves as democrats, but 6% wanted to switch to republican, and 4%
wanted to switch to independent in the upcoming election. |  | • Of the population that identified themselves as republicans, 82% suggested they would continue identifying themselves as
republican, but 10% wanted to switch to democrat, and 8% wanted to switch to independent in the
upcoming election. |
 | •
Of the population that identified themselves as independents,
95% suggested they would continue identifying themselves as independents, but 3% wanted
to switch to democrat, and 2% wanted to switch to republican in the upcoming election. |
 | | |
In this
example, what is the initial distribution matrix, [D0], for a
Markov chain?
|
|
|
5.
|
A large group of people were studied in one town to see which car service they
preferred between Ewe-Ber Transport or Swyft Transport
 Ewe-BER Ewe-BER |  SWYFT SWYFT | | |
A survey was given at the school and found that initially 67% of the population preferred Ewe-BER transport and 33% of the population preferred SWYFT transport.
• Of the population using
Ewe-BER, 80% suggested they would using Ewe-BER
transport next month but 20% wanted to switch to SWYFT transport within the next month.
• Of the
population using SWYFT transport, 85% suggested they would continue using SWYFT transport
next month but Ewe-BER 15% wanted to switch to Ewe-BER transport within the next month.
In this example, what is the transition matrix, [T], for a Markov
chain? a. | 
________________________ | c. | 
________________________
| b. | 
________________________
| d. | 
________________________ |
|
|
|
6.
|
The following shows a graph of the probability of a student to be
“present” or “absent “ from in a Pre-Calculus class during the flue
season. 
In
this example, what would the transition matrix, [T], be for a Markov
chain? a. | 
____________________________
| c. | 
____________________________
| b. | 
____________________________ | d. | 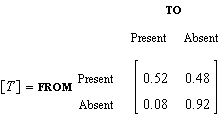
____________________________ |
|
|
|
7.
|
A large sample of customers were given a survey in the U.S. in 2017 about what
type of computer and operating system they preferred to use. The following was determined
 Windows Based
PC Windows Based
PC |  Apple Based PC Apple Based PC | | |
The study
found that initially 86% of the population preferred Windows Based
PC’s and 14% of the population preferred Apple Based
PC’s.
• Of the population that preferred Windows Based PC’s, 82% suggested they would
continue using a Windows based PC over the next 2 years and 18% would switch to an Apple based PC
over the next 2 years.
• Of the population that preferred Apple Based PC’s, 96% suggested they would continue using an Apple based PC over the
next 2 years and 4% would switch to an Apple based PC over the next 2 years.
If the
rates remain constant for the next several decades and both types of PC’s are still available
what would be the approxiate final distribution percentage of users for each type of PC? a. | 
_____________________
| c. | 
_____________________
| b. | 
_____________________
| d. | 
_____________________
|
|
|
|
8.
|
The following shows a graph of the rates at which customers purchasing habits on
2 different battery brands ( Durability and Re-energize) based on a study done at an electronics store
“Bettter Buys”. The graph shows the percentage of customers that purchase the same
brand again and the percentage that switch brands. 
If the inital distribution showed that 68% of the population
purchased the Durability brand of batteries and 32% of the population purchased Re-energize
batteries. If the rates remained consistent what would be the final distributions
approach?
|