Name: 
 

Unit 02-05 - Tree Diagrams & Expected Values


Multiple Choice
Identify the choice that best completes the statement or answers the question.
 

 1. 

mc001-1.jpg
A person accidentally dropped a quarter, a dime, and a penny. Which tree diagram represents the correct possible outcomes of how the 3 coins landed?

mc001-2.jpg
a.

mc001-3.jpg

b.

mc001-4.jpg

c.

mc001-5.jpg
 

 2. 

mc002-1.jpg
The following shows a corn maze for participants to walk through. The participants can only go forward and when there is a fork in the path you may assume that people are equally likely to take any one of the paths.  It costs $5 to enter the maze and each participant gets $10 if they come out in a prize area. 
mc002-2.jpg

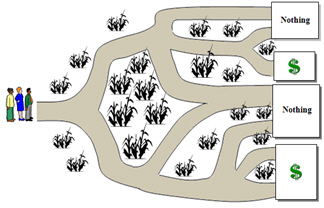
Using a tree diagram or an area model determine the probability that a participant wins money?
a.
0.25
c.
0.43
b.
0.31
d.
0.50
 

 3. 

mc003-1.jpg
An insurance company charges a customer $1600 per year for a particular customer’s auto insurance.  The company has predicted that there is a 10% chance the person will make a claim of on the policy of $5000 (which means the insurance company would lose $3400) and 90% chance that they won’t make a claim.  What can the insurance company on average expect to make on selling this policy?
mc003-2.jpg
a.
$940
c.
$1100
b.
$1020
d.
$2900
 

 4. 

mc004-1.jpg
What is the expected value of the spinner shown?
mc004-2.jpg
a.
1.875
c.
2.125
b.
2
d.
3.25


Check Your Work     Start Over