Multiple Choice
Identify the
choice that best completes the statement or answers the question.
|
|
|
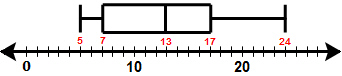
1.
|
Use the Box-and-Whisker Plot to identify the first quartile, Q1.
|
|
|
2.
|
Consider the following Ordered Data
Set.
2, 3, 5, 7, 7, 9, 10
Which is a
correct box and whisker plot of the data above?
|
|
|
3.
|
Consider the following Data Set shown in the line plot below.

If we were to add 2 to every data point to form a new data set, what would the line
plot look like for the new data set?
|
|
|
4.
|
Given the 5 summary statistics of a data set:

Which is
the only data point below that could be defined as an outlier, given a data point, x, is an outlier
if  or  ?
|
|
|
5.
|
Consider the following histogram that shows the ages of people swimming in a
hotel pool. According to the histogram
how many people in the pool could be exactly 30 years old?
|
|
|
6.
|
Consider the following histogram

Which ordered data set
below could this histogram represent?
a. | {2, 10, 11, 16, 20, 24} | b. | {3, 13, 14, 15, 20, 30} | c. | {10, 11, 11, 16, 20,
25} |
|
|
|
7.
|
Which histogram below shows a data set that is
skewed left?
|